
What are Resource Adequacy Metrics?
RA metrics are measures that are used to calculate and quantify whether a system’s resources combined with demand-side and interchange contributions will be able to maintain reliable electricity service across a range of specified expected conditions. Typically, these metrics are compared against a pre-determined standard.
Metrics are divided into deterministic and probabilistic categories.
-
Deterministic metrics have been widespread historically and are used in most regions of the world. These indices are much easier to implement than probabilistic metrics. They can be used when there is less uncertainty (i.e., in the dispatching time frame) or when probabilistic analysis is computationally intractable (i.e., as an input in optimal capacity expansion modelling).
-
Probabilistic metrics associate a probability distribution to any factor that has inherent uncertainty and uses the combination of distributions in some way to calculate adequacy. Probabilistic metrics increase accuracy, as they are evaluated based on a range of outcomes and across many days, rather than a single outcome over one day.
The two metrics categories complement each other; deterministic metrics (and standards) are based on, and potentially iterate with, probabilistic methods.
It should be noted that while deterministic metrics provide a benchmark where adequacy considerations are easily input to models that guide capacity expansion or investments, they are not inherently indicative of risk in the way that probabilistic metrics are. Overall, probabilistic metrics are expected performance metrics, while deterministic indices are system-specific descriptive metrics, which do not provide information on the system’s expected performance, nor grounds for direct comparison with other systems.

Deterministic Metrics
Planning Reserve Margin (PRM)
One of the most commonly used deterministic metrics is the planning reserve margin (PRM), which is defined as the difference between the total installed generation capacity and the peak load, divided by the peak load. The installed capacity of each supply source is sometimes de-rated to an “unforced” capacity that represents the likelihood of it being available to generate at times of peak demand. For thermal units, the de-rating factor is typically adjusted to reflect a unit’s forced outage rate, and potentially differs across seasons. Variable renewable resources are adjusted based on their probability of being available during peak load conditions. This accrediting process is discussed further in Resource Accreditation. The PRM is intended to reflect load forecast uncertainty, and if derating does not fully cover outage rates, the margin is intended to also reflect outage rates of the resources.
Some regions are currently proposing modifications to the PRM to account for potential shifts in time periods of risk. The intent is to better account for variable renewable energy and energy-limited resources in a deterministic manner. The adequacy of the system can be maintained by ensuring that an hourly adequacy threshold is met. This threshold is similar to the reserve margin that is maintained operationally. This would ensure that capacity adequacy is assessed for all hours of the study horizon, rather than simply during peak load hours.
Energy Reserve Margin (ERM)
The energy reserve margin (ERM) is another metric that is used as a planning criterion to satisfy load and plan for a reasonable reserve that can be called upon when required. Like the planning reserve margin, it is defined as the difference between the total system available capacity and the total system load, expressed as a percentage of system load. In contrast to the traditional PRM, the ERM is calculated for every hour, rather than only for the peak load hour. This allows for variable renewable energy and energy-limited resources to be better accounted for in a deterministic manner.
Probabilistic Metrics
Probabilistic metrics more directly measure the overall risk on the system, and hence provide a more thorough picture of system reliability than deterministic indices. Probabilistic metrics can be divided into a few subcategories and are intended to work together, as none of these metrics are interchangeable:
-
Average Risk Metrics: Historically, probabilistic metrics have related either the frequency of imbalance conditions or the magnitude of energy imbalance.
-
Frequency and duration metrics such as the often-used “loss-of-load” metrics incorporate information on the frequency and duration of shortfall events, but fail to describe the magnitude of the energy imbalance.
-
Magnitude metrics (or Energy-centric metrics) such as the expected unserved energy (EUE) metric incorporate information on the magnitude of the energy imbalance but not the duration or frequency of the events [1].
-
Combination metrics: The above metrics can be combined to gain additional system information.
-
-
Full distribution metrics report the range of the probability distribution, rather than its expected value. These metrics are being used more frequently than historically.
No single metric presents a full picture of adequacy risk; they each characterize risk differently and should be used complementarily.
Frequency and Duration Metrics
These metrics can also be referred to as loss of load metrics. Probabilistic loss of load metrics measure the average or expected number of capacity shortfalls across a range of randomly generated samples. They can be defined as a count of shortfalls across any number of event periods, such as event-hours, event-days or event-years.
Since all these metrics have slightly different meanings, it is unwise to convert a standard used for one of the metrics with another as this can lead to false equivalences. For example, converting the “1 day in 10 years” criterion to “24 hours in 10 years” or “1 event on 10 years” can be interpreted differently in the context of resource adequacy.
| Metric | Differences in “1-in-10 | Effect On Reliability | Effect On Costs |
|---|---|---|---|
| Loss of Load Event (LOLEv) | 1 event in 10 years | Most stringent | Most costly |
| Loss of Load Days (LOLD) | 1 day in 10 years | Middle stringent | Middle costly |
| Loss of Load Hours (LOLH) | 24 hours in 10 years | Least stringent | Least costly |
What is ‘Loss of Load’
It is important to properly interpret the “LOL” part of loss of load probability. In an interconnected system, an emergency is often mitigated by a neighboring system, acting either through a reserve-sharing group or perhaps as an emergency import. The LOL event would not truly be loss of load, but rather an unanticipated emergency import from the neighbors.
It is also useful to consider how a LOL event would unfold. Although possible, it is unlikely that the LOL event presents itself quickly to the system in the same way that a contingency event does, and therefore tapping into the resources of a reserve-sharing pool may be difficult. Instead, it is likely that the scarcity is forecasted by system operators and conservation notices issued to customers before demand begins ramping up. Initially, the resources in the dispatch stack can presumably keep up. But at some level, it becomes apparent that demand will outstrip supply. System operators have some options, including running “lean” and deploying contingency reserves to help meet demand, or shedding load to maintain the operating reserve margin. This may be a controversial option because it can put the entire system at risk if a resource were to fail, but it is an option. Voltage can also be reduced. But as demand continues to increase, emergency measures such as planned, stepwise involuntary load shedding would be likely. This event, then, would possibly unfold over many minutes, or even hours.
It is important to note that loss of load metrics cannot necessarily be used interchangeably. Since they all have slightly different meanings, converting between one and another can lead to false equivalences. Converting the “1 day in 10 years” criterion to “24 hours in 10 years” or “1 event on 10 years” can be interpreted differently in the context of resource adequacy.
Acronym: LOLE
Definition: This is defined as the expected count of event-periods per study horizon, with an “event-period” defined as a period of time during which system resources are insufficient to meet demand.
Additional Notes: The length of the event-period is not specified in the definition of this metric, and therefore it can be reported for any kind of event-period, as long as the units are clearly defined. LOLE is often expressed in terms of shortfall days per year (or LOLD) in North American studies or shortfall hours per year (LOLH) in European studies.
Acronym: LOLP
Definition: LOLP is the expected percentage of event-periods per horizon.
Additional Notes: The event-period and horizon need to be explicitly specified when communicating LOLP results, as they cannot be inferred from the unit of the metric. As it can be calculated for any chosen event-period and horizon length, the resulting LOLP is highly dependent on the analyzed periods and horizons.
Acronym: LOLH, LOLE hr/yr
Definition: Defined as the expected count of event-hours per study horizon.
Additional Notes: Unlike LOLD (described below), when a study uses a LOLH metric, it typically evaluates shortfall risk for all hours of the study horizon. As it is the mainstream duration metric with the smaller event-period resolution, it provides the best approximation for aggregate shortfall duration across the study horizon of all the duration metrics listed in this section.
Acronym: LOLD, LOLE d/yr
Definition: Expected count of event days per study horizon.
Additional Notes: LOLD is reported identically regardless of the number of consecutive or non-consecutive loss of load hours per day. Historically, LOLD was calculated using peak load hour, but it may be calculated using a subset of hours or all hours of a given time horizon. Given this calculation flexibility, it is important to understand how a LOLD value has been calculated, as a value based on all hours of the day will be larger than a value based on the daily peak load hours, for example. This is because there may be shortfall events outside of peak load hours that are not captured when only such hours are considered. System characteristics such as the relative “peakiness” of the daily load profile, chronological aspects of generator performance, and other factors determine the magnitude of the delta between the two LOLD calculations.
Acronym: LOLY
Definition: Expected count of event-years per time horizon. For example, if there is at least one shortfall event measured in an entire year, then it is measured as an event-year. Multiple shortfalls within the same year are not differentiated.
Additional Notes: This metric is not commonly used.
Acronym: LOLEv, LOLF
Definition: The expected count of adequacy events per study horizon (e.g., 1 event per 10 years), with an adequacy event defined as a contiguous set of hours with a shortfall.
Additional Notes: This is the only metric that truly measures the frequency of shortfalls. Unlike LOLD, LOLEv acknowledges that there may be days with multiple events per day (LOLEv > LOLD) or events that span multiple days (LOLD > LOLEv). All hours of the study horizon must be modeled to calculate this metric accurately. It is especially beneficial to calculate this metric in systems where events may occur multiple times in a single day, such as systems with a high net load factor (i.e., a flatter load shape, for example systems with a predominantly industrial load or systems with a high amount of storage penetration, among others) or systems sensitive to forced outages from larger generators. A metric such as the LOLD metric with a longer event-period wouldn’t be able to capture the intra-day shortfall behavior. Additionally, although it does not consider the size or duration of the loss of load events, it is very useful when evaluated in combination with other metrics. For example, a system where LOLH and LOLEv are approximately equal would indicate that most events are short in duration.
Magnitude Metrics
Metrics that describe the magnitude of shortfall events complement the loss of load metrics described above.
One feature of using energy-centric metrics is that they are more sensitive to large, disruptive, and catastrophic shortfall events than frequency and duration metrics. Additionally, EUE can be combined with a value of lost load (VOLL) estimation to monetize the cost of loss-of-load. This helps planners understand the impact of adequacy shortfall events, as well as justify, prioritize, or rank transmission or generation projects.
The disadvantage of using these metrics is that they can minimize the impact calculation of frequent but small events that may be inconvenient to customers or politically damaging. While these may not cause significant societal harm, they are likely unacceptable from a planning perspective. Additionally, although energy-centric indices are not necessarily more complicated to understand than loss of load metrics, the power systems community has limited experience setting energy-centric adequacy criteria. They are sometimes interpreted as more difficult to understand and explain to stakeholders than a traditional “1 day every 10 years” metric.
Acronym: EUE/EENS
Definition: The total expected amount of unserved energy in MWh in a given study horizon.
Additional Notes: One of the most common energy centric metrics.
Acronym: NEUE
Definition: The total unserved energy as a percentage of system load instead of MWh.
Additional Notes: This metrics allows for a comparison of relative risk levels across systems of different sizes or different future scenarios.
Combination Metrics
Combining existing probabilistic metrics can provide different insights than using them alone.
-
The LOLH/LOLEv metric (expressed in hours/day) calculates the number of unserved load hours per loss of load day or the average shortfall duration.
-
The EUE/LOLD metric (expressed in MWh/day) calculates the average unserved energy per loss of load day, which can be useful to system planners when sizing energy storage and demand response resources.
-
The EUE/LOLH metric (expressed in MW) quantifies the average unserved energy per loss of load hour, or the average amount of capacity shortfall on the system, which can be used to size resource mitigations.
These examples are not meant to be an exhaustive list but rather an illustration of the additional system insights gained when using existing metrics in combination. While combination metrics can provide additional insight into average event duration and size, they remain approximations and should not be used as a substitute for calculating these values directly from the Monte Carlo data.
Full Distribution Metrics
The distribution of resource adequacy metrics provides a fuller understanding of risk. Unlike loss of load metrics that report an “expected” value or the average across many samples, full distribution metrics aim to better characterize the impacts of outlier events. For example, an extremely rare event that lasts 72-hours could significantly affect the economy and human health. These high impact, low probability (HILP) events may be important to understand and mitigate but are often hidden within the standard expected value metrics.
Calculating the standard error to mean (SEM), or the 25th, 50th, and 75th percentile, offers the planner a better picture of the risk distribution, rather than just the average risk. Calculating the 95th or 99th percentile allows the user insight into extreme, or tail-end events driving a lot of the resource adequacy discussions today.
Additionally, the power systems field can borrow from established risk-analysis metrics used in other fields. For example, the conditional value at risk (CVaR) metric, commonly used in the financial sector, measures the weighted average outcome of tail-end events. CVaRα calculates the expected value of all outcomes beyond the αth percentile.. Many of the commonly used RA metrics do not satisfy the mathematical property of sub-additivity, leading to sometimes counter-intuitive outcomes in which a large region shows a more significant RA risk than the sub regions within it. Using the CVaR metric eliminates this problem, as it is a coherent metric; it satisfies the mathematical properties of monotonicity, sub additivity, homogeneity, and translational invariance.
Acronym: LOLE95
Definition: A statistical calculation used as a basis for determining the anticipated number of hours during which resources are unable to cover the load for a statistically abnormal year.
Additional Notes: This metric represents a modification to loss o load metrics that has been previously used by the European TSO, Elia. In its application, the supply resources include interconnections [3]. LOLE95 covers the 95th percentile of loss of load hours. Elia has previously set LOLE95 to 20 h per year, compared to 3 h per year for LOLE, in Belgium.
Characterization Metrics
The loss of load metrics discussed previously all summarize the aggregate frequency or amount of resource adequacy shortfalls. While they provide a measure of the average number of shortfalls over a study period, they do not characterize the magnitude or duration of specific outage events. As a result, the metrics are unable to differentiate between different events. In power systems with the increasing role of energy-limited resources like energy storage and load flexibility that can be very helpful in responding to certain events but may be less suited to others, it is increasingly important to also characterize the size, frequency, duration and timing of the shortfall events that do occur, in addition to the aggregate metrics outlined in the preceding paragraphs [4]. This is done through characterization metrics that provide distributions on the individual events rather than the probability of events occurring. For example, a characterization metric could summarize event shortfall by duration, such as 50% of shortfall events are between 0-2 hours, 30% are between 2-4 hours, and 20% are greater than 4 hours. Similar summary statistics can be calculated for size (MW), magnitude (MWh), and timing (month, season, hour of day, etc.). This allows resources to be selected and sized based on specific adequacy needs.
Finally, power system planners can also use visualization techniques to complement metrics. Graphics and other visuals can provide a more comprehensive view of the system adequacy risk.
[4] Resource Adequacy Task Force, "Redefining Resource Adequacy for Modern Power Systems," Energy Systems Integration Group, Reston, VA, 2021
Using Multiple Metrics
Most utilities will pick a single resource adequacy metric as the target for their LOLE studies when the goal is to identify a single planning parameter like PRM. However, evaluating a system via multiple metrics provides a fuller picture of its resource adequacy. EPRI’s ongoing RA effort is examining this aspect and looking at how different metrics could be used to provide greater insights.
In a system with an increasingly diverse supply and demand, the previously held assumption that LOLE and EUE are closely correlated may no longer hold as the net load profile becomes increasingly variable. A more explicit effort to examine frequency, duration and magnitude metrics concurrently is warranted. As seen in [5], the figure below illustrates how different reliability metrics may be complementary, describing different dimensions of system adequacy for a specific event. Each blue block represents a quantity of demand that is shed due to inadequacy. The dashed PRM line indicates a fictious planning reserve margin above the peak demand forecast for that system, expressed in MW. PRM has been added to the Figure to illustrate how it remains static, giving information on the capacity of a system to meet peak demand and not its expected performance.
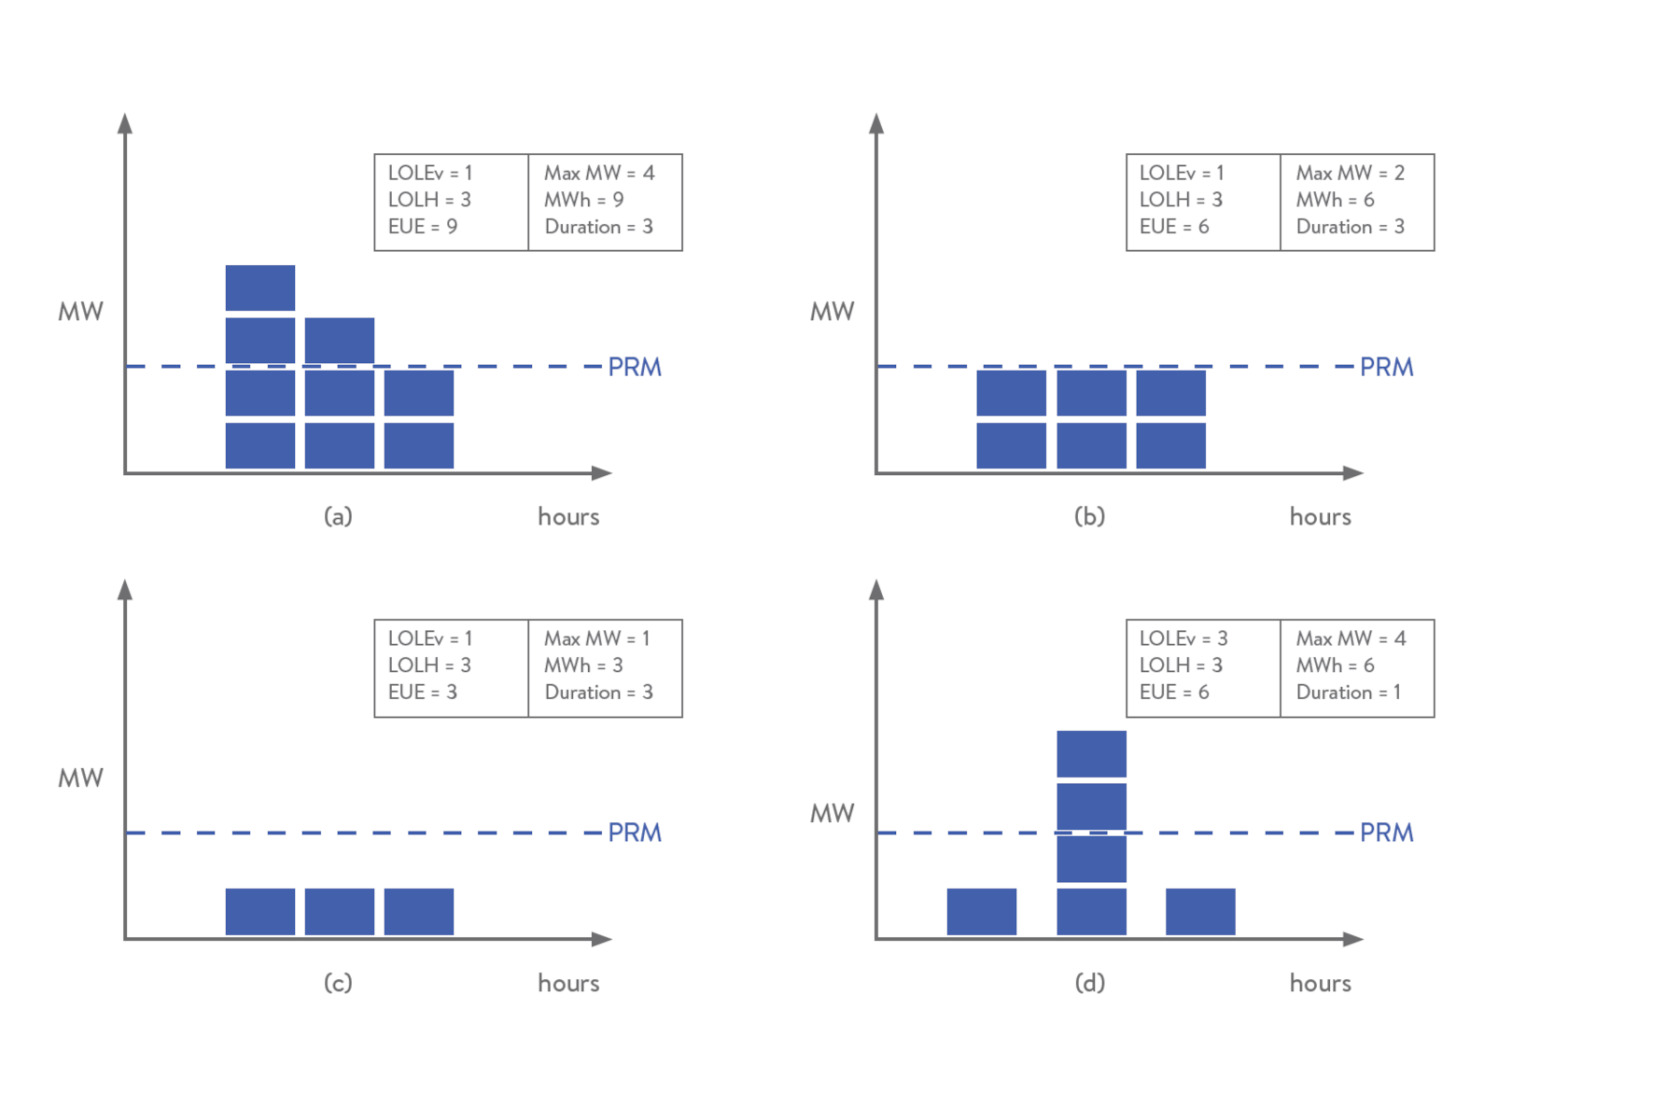
Figure Figures (a) and (c) above show two events where load is lost for three hours. LOLEv and LOLH indices show the same values for these two very different events, EUE however uncovers that even if both of these are single events occurring for three hours, the supply shortage is three times greater in event ‘a’ than in event ‘c’.
Similarly, Figures (b) and (d) above show two distinct instances where the expected unserved energy is 6 MWh for both, with 3 hours of supply adequacy issues in both cases. Considering LOLEv shows that, while loss of load occurs in one single event in case ‘b’, there are three separate loss of load events in case ‘d’.
[5] Redefining Resource Adequacy Task Force, “Redefining Resource Adequacy for Modern Power Systems,” Energy Systems Integration Group, Reston, VA, 2021.
The purpose of this site is to bring together information to help those trying to assess resource adequacy. It draws on a wide range of work that EPRI and the industry has conducted in response to the challenges arising as power systems evolve. We welcome your feedback and suggestions to make this website increasingly useful to support you and your decisions.