
These results can indicate broader industry trends when compared to the findings of EPRI’s 2014 study [2]. Table 1-7 provides a side-by-side comparison of the 13- and 23-year forecasts of Achievable Potential from this latest study (2017 to 2040) and the previous study (2012 to 2035).
Table 1-7. Comparison of Latest Results and Previous Forecast of Achievable Potential
The latest results found that the CAGR of electricity consumption from 2017 to 2040 was reduced by 28% (from 0.62% in AEO2018 Reference case to 0.45% with Achievable Potential). This is compared to a 51% reduction in CAGR from 2012 to 2035 found in the previous study (0.72% in AEO2012 Reference to 0.36% with Achievable Potential).
The primary sources of difference between the previous results and the latest can be attributed to two primary causes:
-
Reduction in energy costs, which have reduced the number of technologies that pass the economic cost test used (TRC)
-
Reduced unit energy consumption, particularly with LED lighting, that has driven down the forecast of baseline energy consumption
Although savings are achievable in a range of end uses in the residential, commercial and industrial sectors, Figure 1-6 presents the top three end uses offering achievable savings in each sector in 2040. Residential central air- conditioning presents significant opportunities for energy savings, followed by commercial electronics (apart from personal computers and servers, which are treated separately), including printers, copiers, scanners, fax machines, phones, and networking equipment. The industrial facilities end-use is third overall, which includes HVAC, water heating and lighting for the industrial sector.
Space cooling is represented in the top three for both residential and commercial where more efficient central air conditioners, room air conditioners and chillers present cost- effective energy savings above and beyond what is mandated by codes and standards. Water heating also provides an opportunity for significant savings in the residential sector for units with capacity below 55 gallons (208 L).
Figure 1-6. Top Three End Uses with Achievable Energy Savings in 2040
Figure 1-7 shows the top ten measures with the highest achievable potential in 2040 across all three sectors. Note that linear fluorescent lighting has slightly higher potential in 2030 than 2040. This is can be attributed to a shift of the baseline to highly efficient LED technology, which are projected to account for an increasing proportion of the commercial lighting stock.
Figure 1-7. Top 10 Measures with Highest Achievable Potential in 2040
Regional Results
This study disaggregates baseline electricity consumption and potential energy savings by the ten U.S. Census divisions plus the four largest states (California, Texas, Florida, and separating New York for the first time), as shown in Figure 1-8. The four major census regions are composed of the following divisions:
-
Northeast: New England, New York, Middle Atlantic
-
Midwest: East North Central, West North Central
-
South: South Atlantic, Florida, East South Central, West South Central, Texas
-
West: Mountain North, Mountain South, Pacific, California
Figure 1-8. Geographic Divisions Analyzed: Ten Census Divisions plus Four States
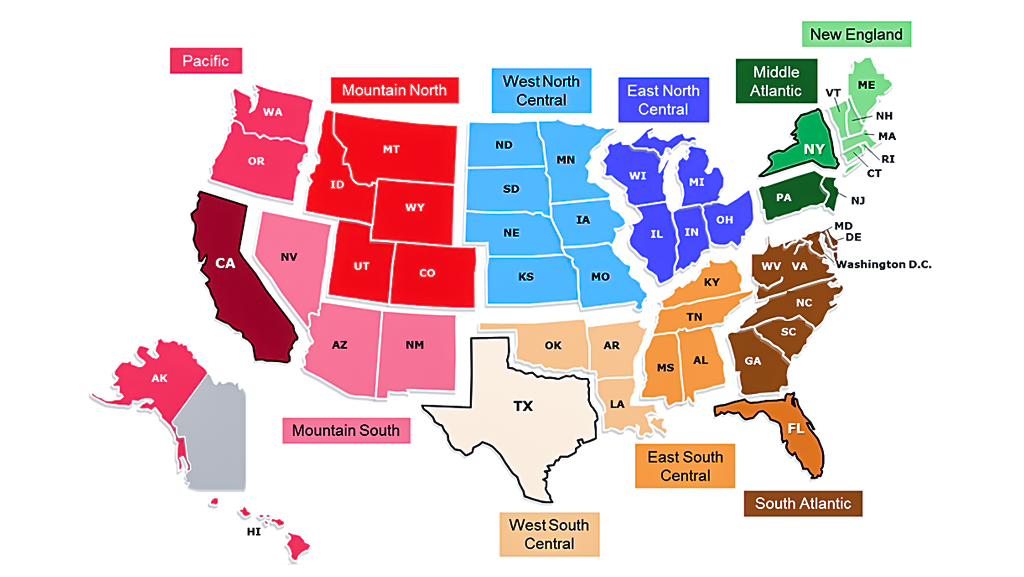
Figure 1-9 shows the breakdown of Achievable Potential in 2040 by division.
Table 1-8 compares the Baseline energy consumption in 2017 and 2040, with compound annual growth, compared to the 2040 Achievable Potential for each of the four census regions (Northeast, Midwest, South, and West).
Table 1-8. Baseline Energy Consumption and 2040 Achievable Potential by Region (GWh)
A few key takeaways for achievable potential in the four census regions include:
-
Electricity consumption is highest in the South region, which is projected to grow at the highest rate of 1% on average per year. Correspondingly, the South has the highest potential savings of the four regions, which can be attributed to the high penetration of air-conditioning and heat pumps in this region.
-
Electricity consumption is lowest in the Northeast region, which is projected to grow at a rate of 0.3% on average per year. The achievable potential of the Northeast is also the lowest of the four regions.
-
The Midwest is the second largest region in terms of both current and forecast growth, with an annual growth rate of 0.6%.
-
The West is the second smallest in terms of energy consumption, although it is second largest in terms of Achievable Potential and annual growth rate (0.8%).
Table 1-9 shows the 2040 achievable potential for each division, broken out by end-use sector. For the South census region, the potential for savings is highest in the residential sector due to space cooling, but the commercial sector offers the highest potential in the other regions.
Table 1-9. 2040 Achievable Potential by Sector for Each Division
Note: To see complete data, use the “all” option in the items per page dropdown.
Figure 1-10 illustrates how the savings in each sector compares to the division’s baseline consumption. Although absolute savings vary among divisions, savings as a percentage of the division’s baseline range from 6% (in New England and the West North Central division) to 12% (Florida).
Figure 1-10. 2040 Percent Achievable Potential by Sector for Each Division
When the achievements of existing efficiency programs are considered, as accounted for in EPRI’s Adjusted Baseline, the achievable potential that remains is reduced by the savings already captured. In some divisions, the achievable potential may be mostly collected, leaving little in terms of remaining achievable potential. Figure 1-11 shows the achievable potential that is estimated to be remaining for each division in 2040, broken down by sector. Only four divisions are estimated to have greater than 50% achievable potential remaining—Florida, East South Central, West South Central, and Texas—all of which are in the South region. The largest difference between these divisions and those with less than 50% is due to the remaining potential in the residential sector.
Figure 1-11. 2040 Remaining Achievable Potential by Sector for Each Division
Note that the Achievable Potential shown refer specifically to the potential energy savings that can be achieved in the 2040, which represent the total energy savings in that year of all efficient equipment installed above baseline (including equipment installed in prior years). Several divisions are estimated to exhaust the Achievable Potential in 2040, but it is likely that these regions have potential savings in the preceding years. Note that these estimates are based on the continuation of historical trends in the effectiveness of existing efficiency programs. It is possible that potential savings may grow if these trends change.
To better understand where this achievable potential exists, the end-uses with the highest 2040 achievable potential in each division are identified, grouped by census region in Table 1-10 through Table 1-13. In each of these tables, the top three measures are depicted for each division regardless of end-use sector. In many divisions, particularly in the South region, residential central air- conditioning (AC) presents the largest achievable potential. The next most common top measure is commercial electronics (non-PC, copier, fax, nor server). Residential heat pumps are found to the be the top measure in Florida, and industrial facilities in the East North Central division.
Table 1-10 lists the top three measures for each division in the Northeast region. Commercial electronics is the top measure in each of the three divisions, with industrial facilities and commercial PCs presenting significant opportunities as well.
Table 1-10. Top Three End Uses for 2040 Achievable Potential, Northeast Census Region
Notes: New England includes ME, NH, VT, MA, RI, and CT. Middle Atlantic includes PA and NJ.
Table 1-11 lists the top three measures for each division in the South region. Residential central AC is the top measure in each division except Florida, where residential air-source heat pumps offer the highest achievable potential. Residential water heating (below 55 gallons) is also found to offer high potential in all South divisions, with industrial facilities the next greatest opportunity.
Table 1-11. Top Three End Uses for 2040 Achievable Potential, South Census Region
Notes: South Atlantic includes WV, VA, DE, MD, DC, NC, SC, and GA. East South Central includes KY, TN, MS, and AL. West South Central includes OK, AR, and LA.
To see complete data, use the “all” option in the items per page dropdown.
Table 1-12 lists the top three measures in the two Midwest divisions. Residential central AC, industrial facilities, and commercial other electronics make up the top three for both divisions, although trade order between the two.
Table 1-12. Top Three End Uses for 2040 Achievable Potential, Midwest Census Region
Notes: East North Central includes WI, MI, IL, IN, and OH. West North Central includes ND, SD, MN, NE, IA, KS, and MO.
Table 1-13 lists the top three measures for each of the four divisions in the West region. Residential central AC, industrial facilities, and commercial other electronics are prominent opportunities in the West region as well, although commercial copiers/printers and personal computers round out the list in California.
Table 1-13. Top Three End Uses for 2040 Achievable Potential, West Census Region
Notes: Mountain North includes MT, ID, WY, UT, and CO. Mountain South includes AZ, NM, and NV. Pacific includes WA, OR, AK, and HI.
To see complete data, use the “all” option in the items per page dropdown.
Sensitivity Analysis: Increased Avoided Costs
A final analysis looks at the impact of increased avoided costs on the achievable potential. This analysis serves to help understand the potential gains in potential energy savings that may be achieved through federal or state policies designed to internalize additional externalities, or capture non-energy benefits or costs.
In order to assess the impact of higher avoided supply costs, a $50/MWh premium was added to the avoided energy cost used in the TRC to increase the total avoided costs (increasing the program benefits in the numerator). Each measure is tested for cost-effectiveness in each year 2018 through 2040, and in each of the 15 Census divisions/states.
A $50/MWh increase in avoided energy costs increased 2040 achievable potential by 7% across all sectors as shown in Figure 1-12, with an 18% increase in the residential sector and a 1% increase in both the industrial and commercial sectors.11 Table 1-14 illustrates the cumulative baseline forecast and achievable potential energy savings for the residential, commercial, and industrial sectors.
Table 1-14. Impact of Increased Avoided Energy Costs on Cumulative Achievable Potentials with Cumulative Baseline Consumption
The impact of increased avoided energy costs is most visible in the residential sector, with $50/MWh increasing the 2018 to 2040 cumulative achievable potential by 20% compared to the base case without incentives. These impacts are shown over time relative to the baseline in Figure 1-13.
Figure 1-12. Overall Impact of Sensitivity Analysis with Higher Avoided Costs
The impact of increased avoided energy costs is most visible in the residential sector, with $50/MWh increasing the 2018 to 2040 cumulative achievable potential by 20% compared to the base case without incentives. These impacts are shown over time relative to the baseline in Figure 1-13.
Figure 1-13. Residential Achievable Potential with Increased Avoided Energy Costs
Figure 1-14 illustrates the baseline forecast and two levels of achievable potential energy savings for the commercial sector. The effect of incentives is not quite as impactful as in the residential sector, with $50/MWh increasing the 2018 to 2040 cumulative commercial achievable potential by 1% compared to the base case avoided energy costs. This may be due to the limited number of end-uses considered and the number of measures applied in the commercial sector. This is an area for further research.
Figure 1-14. Commercial Achievable Potential with Increased Avoided Energy Costs
Figure 1-15 illustrates the baseline forecast and achievable potential savings for the industrial sector. The top-down model of the industrial sector does not include economic inputs, rather an economic level of efficiency is applied in different manufacturing segments by end use and scaled to reflect customer barriers in the achievable potential case. Therefore, to estimate the impact of incentives on the achievable potential in the industrial sector, commercial sector results are used. The increased savings found in each scenario of increased avoided costs in the commercial sector is used to scale up the achievable potential in the industrial sector. Therefore, incentives have a similar impact in the industrial sector, with $50/MWh increasing the 2018 to 2040 cumulative achievable potential by 1% compared to the base case without incentives.
Figure 1-15. Industrial Achievable Potential with Increased Avoided Energy Costs
Overall the impact of increased avoided energy costs resulted in about an 8% increase in cost-effective achievable potential when the baseline avoided energy costs are increased by $50/MWh ($0.05/kWh). This suggests that once the cost- effective energy efficiency potential is captured, much of the easy-to-obtain, elastic energy efficiency has likely been achieved, and without additional cost- effective measures, the incentive impact will diminish. However, the impact of incentives could have a larger impact in regions where energy efficiency has not yet been fully realized as a low-cost energy resource.
11 Due to the limited resolution available in the industrial sector model, the relative impact observed in the commercial results was applied to the industrial sector.