Context and Purpose
Intended Audience
- Utilities
- Academics
- Policy-makers
- Others

What It Covers
- New technologies, cost effectiveness, and codes & standards
- Impacts by region, customer classes, and end-uses

How to Apply
- Provide a sound basis for decision making
- Program design of energy efficiency (EE) programs

Project Scope
Focus of Summary: Decreasing Electricity Use
Replacing electric use with MORE EFFICIENT electric use for the same or better quality of service.
This Report: 3002014926
Other Efforts: Efficient Electrification
Replacing inefficient primary energy use with more efficient energy use.
EPRI Reports: 3002013582 and 3002017017
Study Drivers, Assumptions, Capabilities
- MOTIVATION: Update previous Potential Studies to reflect changing markets and technologies
- OBJECTIVE: A technically sound estimate of electricity savings
- STUDY PERIOD: 2017 to 2040
- ASSUMPTION: No energy codes or standards beyond existing ones
- INCLUDED: Updated assessments of avoided costs, technology costs and impacts
- MODELS: Energy savings based on the 2018 Annual Energy Outlook

- Incorporates distribution avoided costs
- Includes state-level (in addition to regional) energy efficiency potential
- Assesses sensitivity to higher avoided costs
Electricity Uses Considered
Residential & Commercial
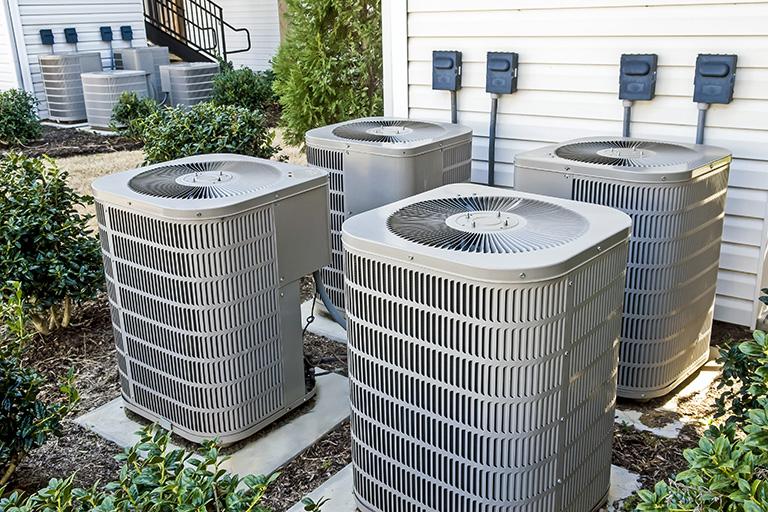
- Space heating and cooling equipment
- Secondary heating/cooling measures
- Water heating and secondary measures
- Appliances and electronics
Industrial Processes
- Compressed air
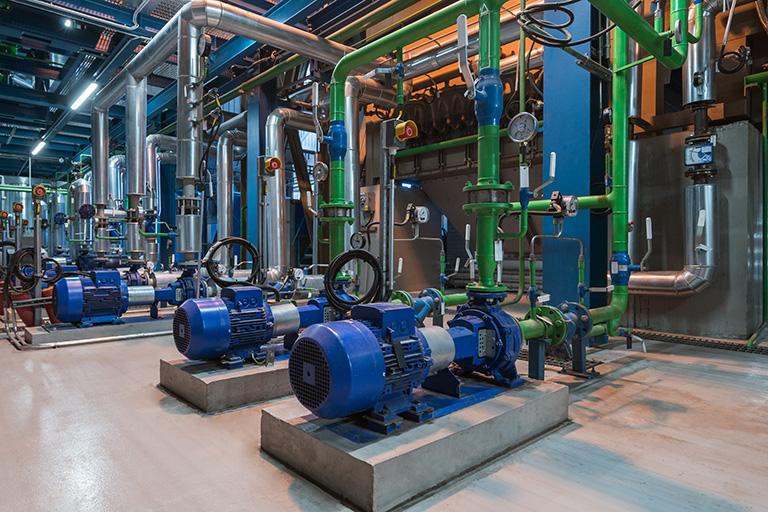
- Fans, blowers, and pumps
- Industrial facilities (HVAC & lighting)
- Process cooling and refrigeration
- Process heating and steam equipment
Study Results
Compared to the AEO2018 Ref Case, this study identified 174 billion kWh of additional, cost-effective savings potential from energy efficiency.
This suggests there is the potential to nearly double the size of efficiency programs by 2040.


In total, efficiency programs could reduce U.S. annual electricity use by up to 8.2% by 2040 (365 TWh).
LOWER GROWTH
Reduces electricity growth from 0.62% to 0.45% (2017 to 2040)
How Much is 365 TWh?
Total electricity use of
34 million
average U.S. homes
(25% of all U.S. homes)

OR

500+
125-MW natural gas-fired combined-cycle power plants running at 65% capacity factor
Conclusion
Electric energy efficiency remains a significant and cost-effective resource.
