This section provides a breakout of achievable potential electricity savings by state. In order to disaggregate down to the state level, EIA’s published data for 2016 state-level electricity sales by class12 were used. Because EPRI’s estimates of potential include existing programmatic savings, it is necessary to adjust the baseline forecasts to add estimated existing programmatic savings back into the forecast AEO Reference Case sales before applying the EIA state-level percent sales to EPRI’s division-level savings potential estimates. This adjustment to the Reference Case consumption was done using ACEEE’s 2016 state scorecard data, using the approach summarized previously in Baseline Electricity Use section.
That baseline adjustment, followed by disaggregating to the state level leads to an estimate of state-level sales to reflect estimated electricity consumption net of programmatic efficiency. This process was repeated for each sector separately. The achievable potentials and adjusted baseline electricity sales were summed separately for each sector and the total achievable potential was divided by the total adjusted baseline sales to determine the sector-level achievable potential for each state as a percentage of total adjusted baseline electricity sales.
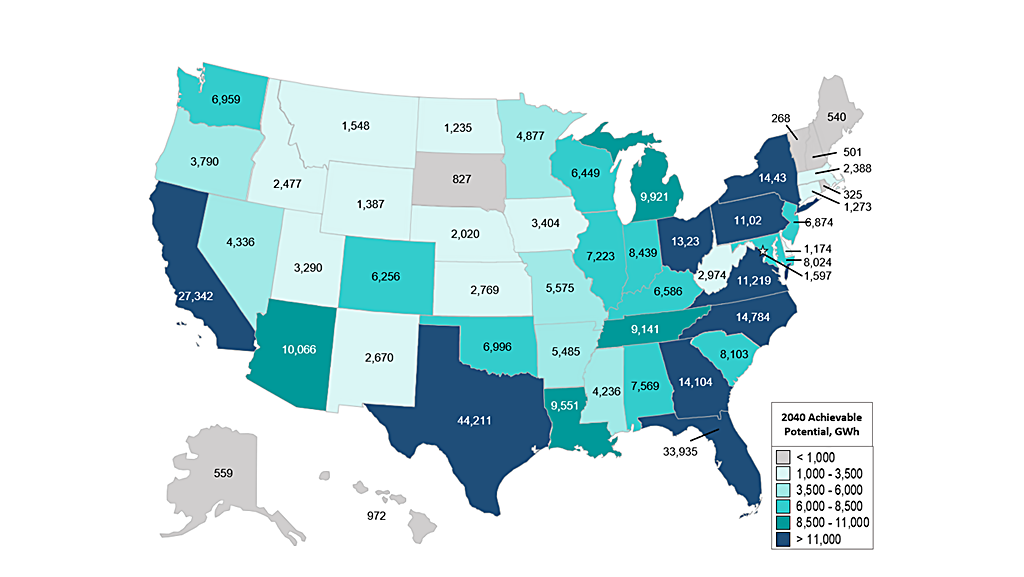
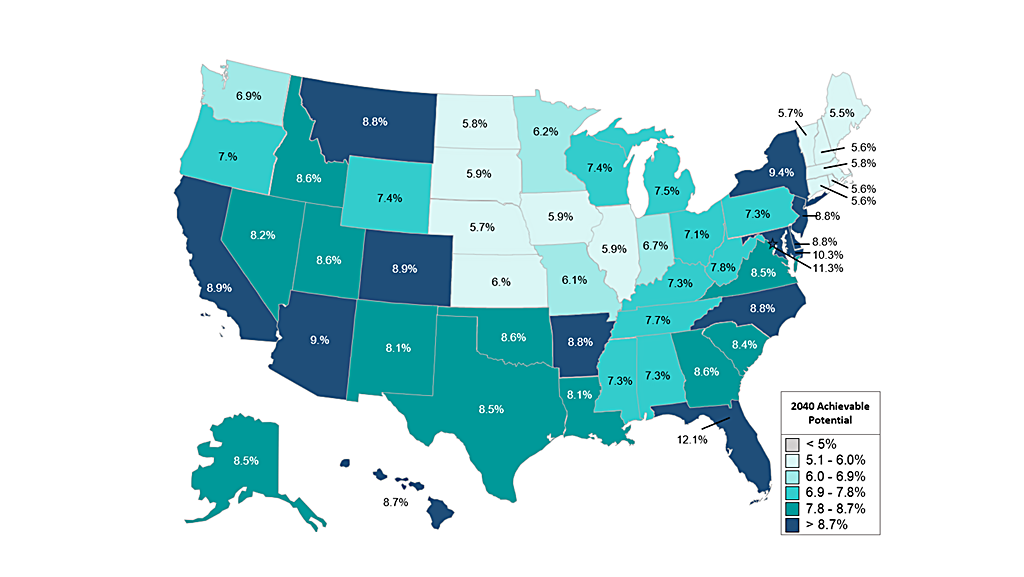
Every state has a large amount of potential electricity savings that can be utilized as a cost-effective energy resource, both in terms of gigawatt-hours (GWh) (Figure 1-16) and as a percentage of adjusted state sales (Figure 1-17). This potential grows over time as equipment reaches the end of its useful life and is replaced by a cost-effective, efficient replacement.
Figure 1-16. Total Achievable Potential by State in 2040, in GWh

The achievable potential in 2040 ranges from 268 GWh in Vermont to 44,211 GWh in Texas, reflective of the both electric loads and the types of electric services in each state, as shown in Figure 1-17. Because the EPRI division-level results were used to determine state-level potential, there is a strong similarity by region in the percent savings. As a percentage of state sales, the achievable potential savings ranges from 5.5% savings in Maine to 12.1% savings in Florida in 2040.
Figure 1-17. Total Energy Efficiency Achievable Potential in 2040, as a Percentage of Adjusted Baseline Sales

Remaining State-Level Achievable Potential
While energy efficiency is a broadly available resource, the extent to which states utilize energy efficiency differs. This benchmark analysis calculates the percent remaining achievable potential by comparing the energy efficiency savings that would be attained by maintaining a state’s average historical savings rate to the state-level achievable potential identified by EPRI. Since it is possible for the state savings to exceed the EPRI identified savings, the adjustment made to baseline energy consumption for each state is capped by the achievable potential savings estimated by EPRI to provide a consistent metric, ranging from 0-100% of achievable potential.
Given the high annual energy savings that have been achieved year-over-year in some states, this benchmark analysis also highlights a limitation of the model. If states with historically high annual savings continue their progress, the compounded savings may exceed the potential that is reported in this study. However, the achievable potential identified here is based on application of an adoption curve to the estimated achievable potential which is determined by input factors including the technologies and customer costs considered, the avoided costs, and the program administration costs. Additional savings are available beyond those projected by the achievable potential by moving to the achievable potential, which represents the full scope of cost-effective savings.
These higher levels of cost-effective savings may be attained by incorporating new technologies, reducing program administration costs, and finding innovative ways to enable energy efficiency savings. If policies mandate higher levels of savings than projected in this study, program administrators might implement new or additional efficiency measures in order to reduce costs and achieve additional achievable potential savings, taking advantage of both technological innovation as well as other energy-saving approaches, such as behavioral savings which are not considered here. Further, as modeled, if real avoided costs increase over time due to changing supply, more energy efficiency becomes cost effective. Thus, this analysis serves as a benchmark, not as a limiting condition for the potential of energy efficiency.
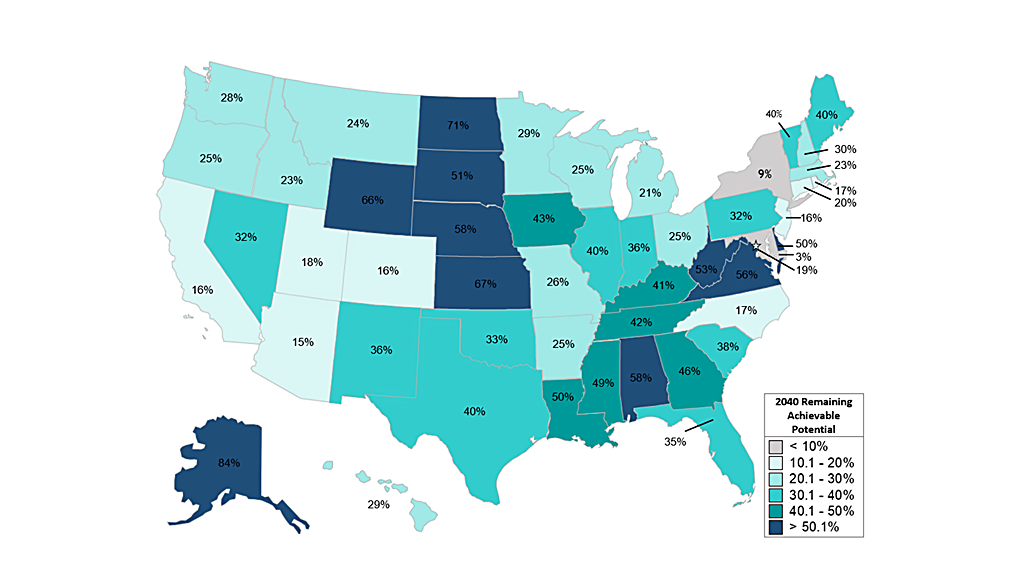
Considering the progress made by some states to already the estimated achievable potential, the remaining savings can be estimated from the achievable potential projected for each state, as shown in Figure 1-18. This metric serves as a benchmark of the extent to which states are in position to utilize energy efficiency as a resource through existing programs, policies and action. States that have achieved historically high levels of annual energy savings (lighter shades) may be challenged to unlock additional savings year-over-year. Yet states that have lagged in capturing energy efficiency have the opportunity to unlock all of the energy efficiency identified here.
Figure 1-18. Remaining 2040 Energy Efficiency Achievable Potential Based on Extrapolation of Average Historical State Savings

12 “Electric Power Annual 2016,” U.S. DOE EIA, Washington DC, December 2017. Table 2.8. https://www.eia.gov/electricity/annual/archive/03482016.pdf. Note that these values are net of current programmatic efficiency and natural conservation.